This article is part of a series published by UReason about failure modes and effect analysis of essential components that are common in various industrial processes such as control valves, pneumatic actuators, electrical actuators, motors, and centrifugal pumps.
A PID controller, which stands for Proportional-Integral-Derivative controller, is a widely used type of feedback control system in automation and industrial processes. It is designed to regulate and control various systems, such as temperature, pressure, speed, and more, to maintain a desired setpoint (target value) by continuously adjusting a control output.
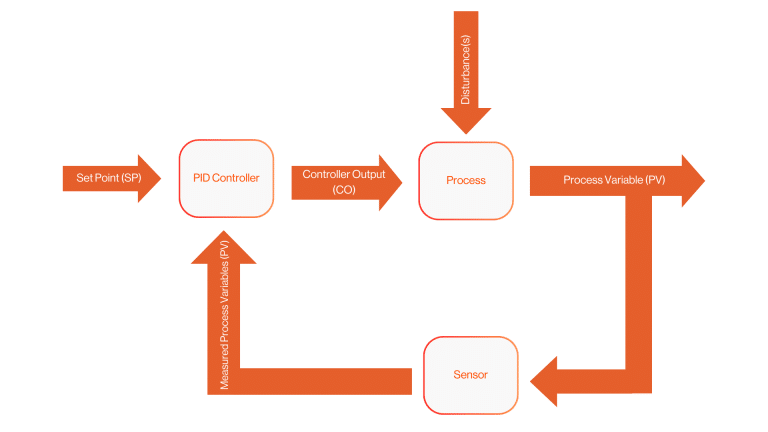
The PID controller operates by continuously calculating an error value as the difference between the desired setpoint and the actual process variable (PV), which is the measured value of the system being controlled. The controller then uses this error signal to determine how to adjust the control output (CO) in order to bring the process variable closer to the setpoint. The control output is typically applied to an actuator (such as a valve, motor, or heating element) to manipulate the system.
Here’s a brief overview of the three components of a PID controller:
1. Proportional (P) Action:
- The proportional term produces an output signal that is directly proportional to the current error (the difference between the setpoint and the process variable). The proportional gain (Kp) determines the strength of this relationship.
- Increasing Kp makes the controller respond more aggressively to error, which can help reduce the steady-state error (the difference that remains when the system has stabilized). However, too much proportional action can lead to overshooting or instability.
2. Integral (I) Action:
- The integral term accounts for past errors by accumulating them over time. It helps eliminate any residual steady-state error and brings the system to the setpoint.
- Integral action is controlled by the integral gain (Ki), which determines how quickly the controller responds to accumulated error. A higher Ki value leads to faster correction of steady-state errors but may introduce overshoot and instability if set too high.
3. Derivative (D) Action:
- The derivative term predicts the future behaviour of the error based on its rate of change. It helps dampen oscillations and reduce overshooting by applying corrective action in anticipation of future error changes.
- The derivative gain (Kd) determines the strength of this corrective action. Too much derivative action can make the system sensitive to noise or introduce instability.
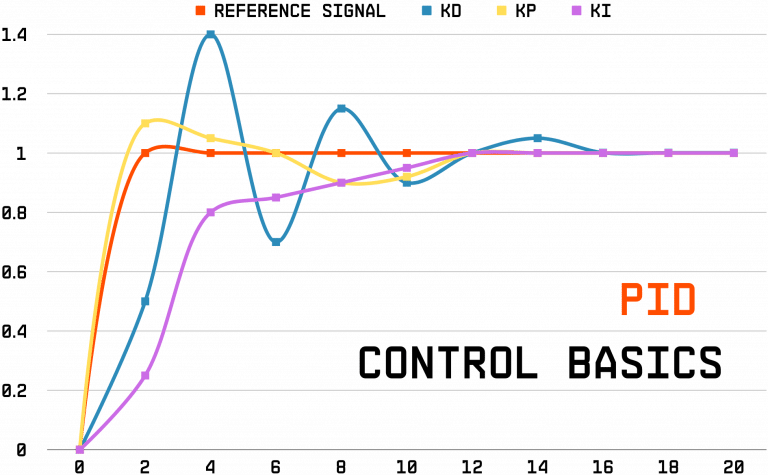
By adjusting the values of Kp, Ki, and Kd, engineers and operators can tune the PID controller to achieve the desired control performance, balancing factors like stability, response time, and resistance to disturbances.
PID controllers are widely used in a wide range of applications, including temperature control in ovens and furnaces, speed control in motors, pressure and flow regulation in industrial processes, and many other systems where precise control is essential. They are known for their versatility and effectiveness in a variety of control scenarios.