
This article is part of a series published by UReason about failure modes and effect analysis of essential components that are common in various industrial processes such as control valves, pneumatic actuators, electrical actuators, motors, and centrifugal pumps.
In a recent post on controlglobal.com, by John Rezabek, the impact control valve failure has and its potential points of failure paint a grim, yet authentic, picture:
“In a continuous process plant, every control valve is a potential single point of failure for its associated control loop, where failure might stem from the actuator, positioner and/or the valve. Depending on the service, such a failure could mean an unplanned shutdown of the entire plant. Also included in potential failures is the communications infrastructure (Ethernet, fieldbus or 4-20 mA), instrument air or other servo-power, the electronics’ power supply, and whatever interface (I/O card) connects the valve to the controller. We’re up to seven single points of failure—potentially—for a single control valve. Your facility might have a 1,000, many of which could have a serious impact.”
A control valve failure can lead to process downtime, product loss, safety risks et cetera. To prevent and address failure modes, regular maintenance, inspection, and monitoring of control valves are essential. As this is costly you will typically apply the principle of ALARP – As Low As Reasonably Possible. Balancing risks against the trouble, time and money needed to control it.
When you take a more holistic view at the simplified, reduced example of the FMEA in the previous blog post and you quantify the existence of the potential effects/consequences a different picture appears. Using data related to control valve operation, that you already store in your data historians and logs, you can provide insights on the development of failure mechanisms using the Control Valve App:
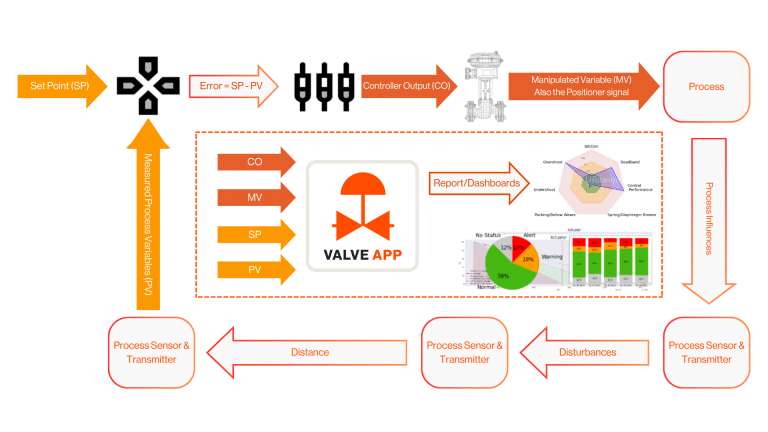
The Control Valve App, which can autonomously inspect your control valve performance, provides advanced detection mechanisms and models and allows you to lower your RPN (Risk Priority Number) scores:

Overall, in this example, the CVA provides a 44% reduction in risk appetite, but more importantly, it provides you with early insights on valve performance and a means to prevent process downtime, product loss, safety risks et cetera introduced by control valve failure.
Want to learn more about the Control Valve App? Request a demo or contact UReason!